Projects
All ProjectsRedbubble Buyer Journey Map

Problem
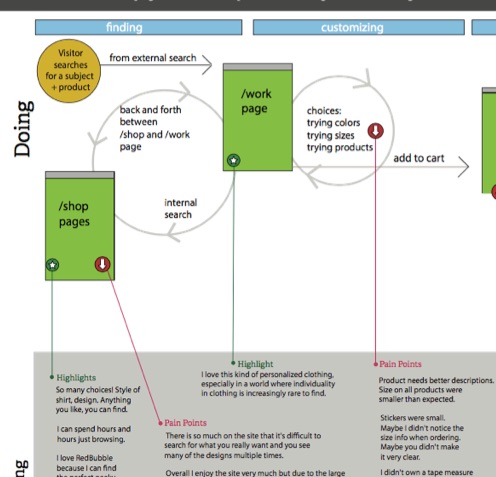
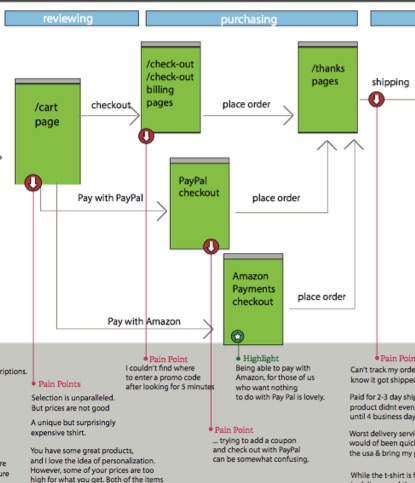
The company needed a better understanding of the buyer journey through the Redbubble website.
Process:
Pairing qualitative and quantitative data to better visualize customer journey on the website and post purchase experience.
Leveraged data from baseline shopping experience sessions, Google Analytics, NPS responses and customer service tickets.
Project Role
- Organized evaluative sessions with new customers to baseline the shopping experience. We held 10 moderated and unmoderated sessions to baseline the website.
- Analysed data from Google Analytics to confirm baseline journeys with quantitative data.
- Analysed data from NPS service to gather additional verbatim quotes to highlight pain points at scale.
- Analysed data from customer service tickets to gather additional data to highlight pain points at scale.